Accounting & Finance Guide
Gibir-Negari is built on a rock-solid accounting foundation. Even if you aren't a trained accountant, this guide explains how our system automatically keeps your financial records perfectly balanced and ready for tax time.
Chart of Accounts (Your Financial Buckets)
📌 Quick Definition
A Chart of Accounts (COA) is a complete list of all the financial "buckets" your business uses to organize money. Every transaction you record goes into one of these buckets. Think of it as a filing system for your finances.
Think of the Chart of Accounts as a giant organizer with different labels. Every single time money moves in your business—whether you buy a pencil, pay rent, or make a huge sale—the money gets sorted into one of these specific buckets. When you first sign up, we automatically create a standard list of buckets for you, perfectly tailored for Ethiopian businesses.
🎯 What It Does
The COA organizes your business finances into five main categories (Assets, Liabilities, Equity, Revenue, Expenses). When you record a sale, purchase, or payment, the system automatically posts it to the correct account. This creates a complete audit trail and makes it easy to generate financial reports.
❓ Why You Need It
- Tax Compliance: ERCA requires businesses to maintain organized financial records. A proper COA proves you are compliant.
- Financial Clarity: You can instantly see how much you spent on rent, salaries, supplies, etc., helping you control costs.
- Accurate Reports: Balance Sheets, Profit & Loss statements, and Tax Reports all depend on a well-structured COA.
- Audit Trail: Every transaction is linked to an account, creating a complete record that auditors and tax inspectors can verify.
1. The Five Main Categories
Every bucket you create must belong to one of these five big families:
2. Folders (Groups) vs. Buckets (Detail Accounts)
To keep things organized, we use a folder system:
- 📁Group Accounts (The Folders)These are like labels on a filing cabinet drawer. For example, "Bank Accounts". You cannot put money directly into a Group. It just adds up the total of everything inside it.
- 🪣Detail Accounts (The Actual Buckets)These are the specific places where money goes. For example, "Commercial Bank of Ethiopia - Acct #123". You put this bucket inside the "Bank Accounts" folder.
3. "System Locked" Accounts
Some buckets in your list have a small lock icon next to them. These are System Accounts.
Why are they locked? Because our automatic math relies on them! For example, when you record a sale, the system needs to know exactly which bucket to drop the tax into.
- VAT Payable: Automatically catches the tax from your sales.
- Sales Revenue: Automatically catches the actual item price from your sales.
- Withholding Tax Payable: Automatically catches the 3% you hold back from big supplier purchases.
You can rename these buckets, but you cannot delete them, because the automatic tax robots need them to work properly!
4. Starting Fresh (Opening Balances)
When you first start using Gibir-Negari, your business isn't starting from zero. You probably already have money in the bank and furniture in your office.
We provide a simple screen where you can type in your Opening Balances. You just tell the system: "I currently have 50,000 Birr in my CBE account, and I owe my supplier 10,000 Birr." The system saves these starting points so your future math is perfectly accurate.
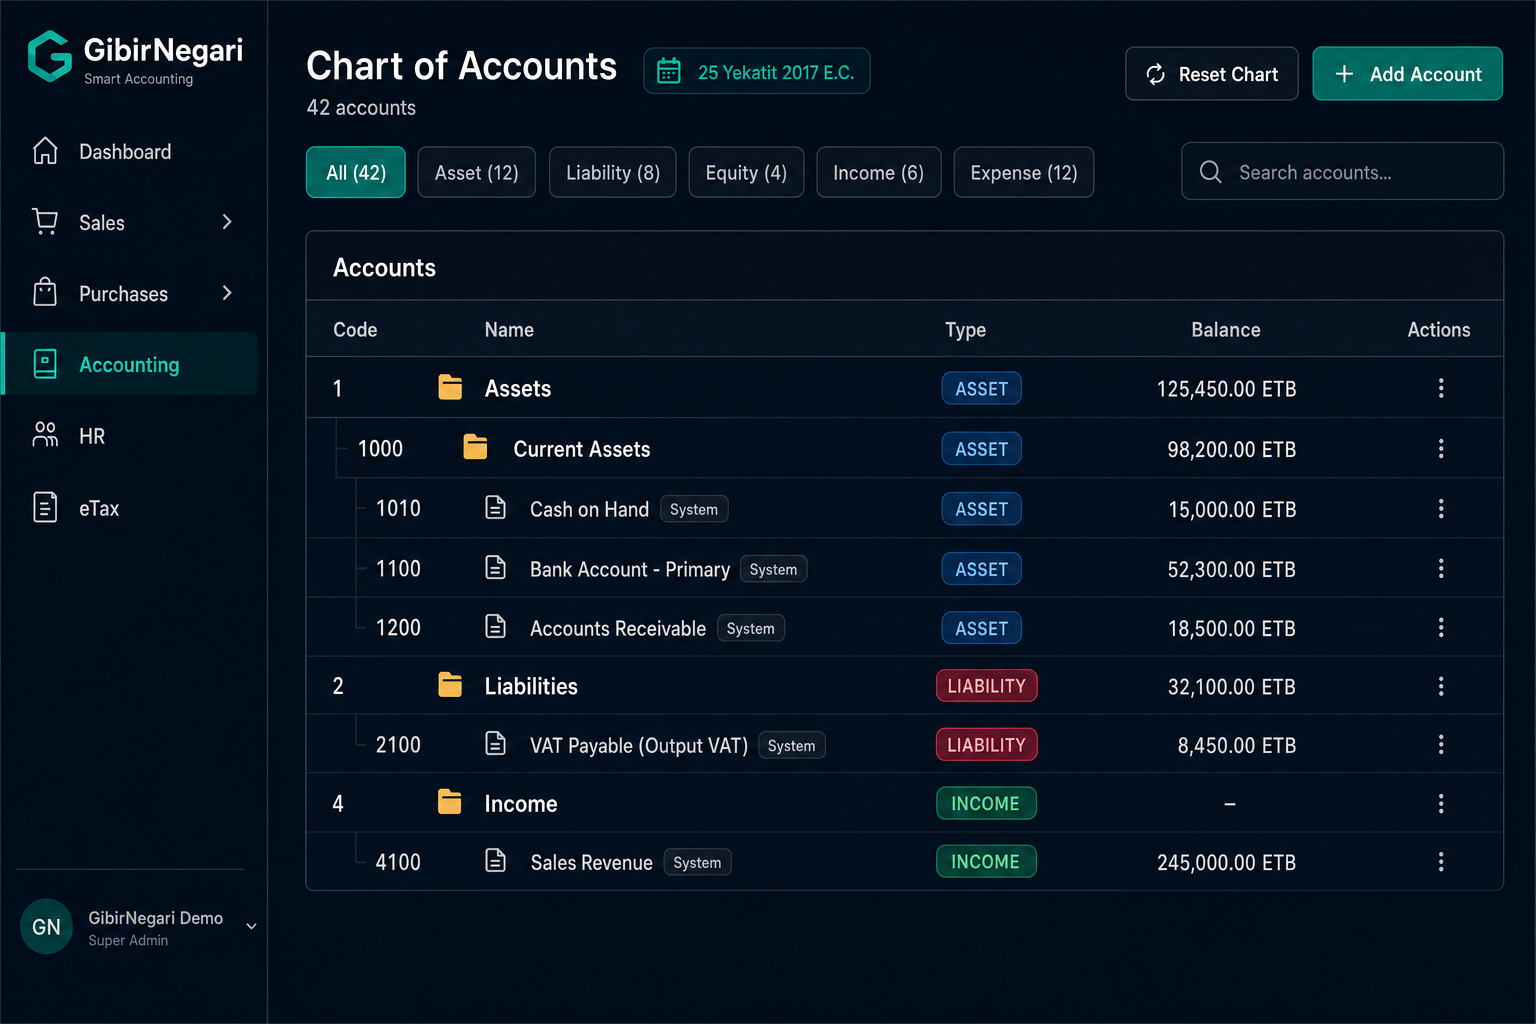
The Chart of Accounts page with category filters, search, and hierarchical account tree.
5. Step-by-Step Operations
Here are the common operations you will perform within the Chart of Accounts module, along with the steps and navigation links.
AView and Filter Accounts
- Navigate to the Chart of Accounts page.
- Use the category buttons at the top (e.g., Asset, Liability) to filter the list.
- Use the search bar to find accounts instantly by their name or account code.
- Click the folder icons to expand or collapse Group Accounts to reveal the Detail Accounts inside them.
BAdd a New Account
- Click the "Add Account" button at the top right of the page.
- Enter a unique Account Code (e.g., "1000") and a clear Account Name.
- Select the Account Type (Asset, Liability, Equity, Income, or Expense).
- Toggle "Group account" if this should act as a folder instead of a transaction bucket.
- If creating a detail bucket, you can optionally select an existing Group Account as its Parent Account to nest it nicely.
- Click "Create".
CAdd a Child Account Directly
- Find the specific Group Account (folder) where you want to add a new bucket.
- Click the "+" (Plus) icon located in the action column on the right side of that row.
- The system will automatically open the creation form with the Parent Account and Account Type pre-selected for you.
- Fill in the Code and Name, then click "Create".
DEdit or Delete an Account
- To edit, click the Pencil icon next to any account. You can rename it or add a description. Note: System Locked accounts have restricted editing.
- To delete, click the Trash icon. Important: You can only delete an account if it has no transactions (journal entries) attached to it.
EReset Chart of Accounts
- If you made mistakes during setup and want to start with a completely blank slate, click "Reset Chart" (in red) at the top right.
- This securely wipes all accounts, GL mappings, and fiscal periods.
- Warning: The system strictly prevents you from doing this if ANY journal entries have been recorded. It is for fresh setups only!
General Ledger (The Complete Record)
📌 Quick Definition
The General Ledger (GL) is the master record of every single financial transaction your business has ever made. It is organized by account, showing all debits and credits for each bucket in your Chart of Accounts.
🎯 What It Does
The GL is like a detailed diary of your business finances. Every sale, purchase, payment, and manual adjustment is recorded here. You can view the GL to see exactly what happened in any account on any date. It is the source of truth for all your financial reports.
❓ Why You Need It
- Audit Trail: Every transaction is recorded with a date, amount, and description. If ERCA audits you, the GL proves what happened.
- Error Detection: If a number seems wrong on your Balance Sheet or Tax Report, you can drill down into the GL to find the mistake.
- Account Reconciliation: You can compare your GL balance for "Bank Account" against your actual bank statement to spot discrepancies.
- Financial Analysis: By reviewing GL entries, you can understand spending patterns and make better business decisions.
How It Works
When you record a sale, purchase, or manual journal entry, the system creates GL entries. Each entry has two sides: a Debit (left side) and a Credit (right side). The fundamental rule is: Debits must always equal Credits. This is called the "double-entry" system and is the foundation of all accounting.
Example: You sell 100 items for 10,000 Birr (including 15% VAT). The system creates two GL entries:
- Debit Bank Account: 10,000 Birr (money coming in)
- Credit Sales Revenue: 8,696 Birr (the actual sale price)
- Credit VAT Payable: 1,304 Birr (the tax collected)
Total Debits (10,000) = Total Credits (8,696 + 1,304). Balanced!
Step-by-Step Operations
Here are the common operations you will perform within the General Ledger module.
AView the General Ledger
- Navigate to General Ledger.
- You will see a list of all posted journal entries, sorted by date.
- Use the filter dropdown to view entries by status (All, Draft, Posted, Voided).
- Click the Eye (View) icon on any row to see the full details of that transaction.
BFilter by Account
- From the General Ledger page, use the Account Filter dropdown.
- Select a specific account (e.g., "Bank Account - CBE").
- The list will show only entries affecting that account, making it easy to reconcile.
CSearch by Date Range
- Use the Date Range picker at the top of the page.
- Select a start and end date to view only entries within that period.
- This is useful for monthly reconciliation or investigating a specific time period.
Manual Journal Entries (Custom Adjustments)
📌 Quick Definition
A Journal Entry is a manual record of a financial transaction. While most transactions (sales, purchases) are recorded automatically, sometimes you need to manually move money between accounts. Journal Entries let you do this while maintaining the double-entry system.
🎯 What It Does
Journal Entries allow you to record transactions that don't fit into the standard Sales or Purchases workflows. Examples: transferring cash from one bank account to another, recording a loan received, adjusting inventory, or correcting a mistake.
❓ Why You Need It
- Flexibility: Not every transaction fits into Sales or Purchases. Journal Entries handle the exceptions.
- Corrections: If you discover a mistake in a posted entry, you can create a reversing entry to fix it.
- Adjustments: At month-end, you might need to accrue expenses or record depreciation. Journal Entries do this.
- Audit Trail: Every manual entry is recorded with a date, description, and full audit trail.
The Golden Rule of Accounting
Whenever you move money manually, the total amount leaving one bucket must exactly match the total amount entering other buckets. The system will strictly prevent you from saving an entry if the numbers don't balance perfectly.
Below, you will find the step-by-step operations detailing exactly how to create and manage these entries.
Step-by-Step Operations
Here are the common operations you will perform within the Journal Entries module, along with the steps and navigation links.
AView and Filter Journal Entries
- Navigate to the General Ledger page.
- Use the dropdown filter at the top right to view entries by status (All, Draft, Posted, Voided).
- Click the Eye (View) icon on any row to open the full details of that transaction, including the exact accounts, debits, and credits involved.
BCreate a New Journal Entry
- Click "New Entry" to go to the Creation Page.
- Entry Details: Enter the Date (using Ethiopian or Gregorian calendar), a Reference number, and a clear Description of what the entry is for.
- Add Lines:
- Add at least two lines for the transaction.
- For each line, select the specific Account, type a line description, and enter the amount in either the Debit or Credit column.
- Balance the Entry: The system strictly checks that your Total Debits exactly equal your Total Credits. It will show "Balanced" in green once correct.
- Click "Create Entry". This saves the entry in a DRAFT status, meaning it has not yet officially moved any money.
CPost a Draft Entry
- From the General Ledger list, click the Eye (View) icon on an entry marked as DRAFT.
- Review the debits and credits carefully to ensure they are correct.
- Click the "Post" button. The status changes to POSTED, and the money is now officially moved in your accounting books.
DVoid or Reverse an Entry
- If you discover a mistake in an entry that has already been POSTED, open its details.
- You can click "Reverse". This automatically creates a brand new journal entry that does the exact mathematical opposite of the mistake, effectively cancelling it out while leaving a perfect audit trail.
- Alternatively, you can click "Void" if the transaction is entirely invalid and needs to be marked as dead.
Asset Categories (Organizing Your Assets)
📌 Quick Definition
Asset Categories are groups that organize your fixed assets by type (e.g. Motor Vehicles, Computer Hardware, Buildings). Each category stores a useful life in years derived from Ethiopian straight-line depreciation rates.
🎯 What It Does
Asset Categories help you organize and manage depreciation. When you create a new asset, you assign it to a category (e.g., "Vehicles"). The system then automatically applies the correct depreciation rate for that category. This ensures your depreciation calculations are accurate and compliant with Ethiopian tax law.
❓ Why You Need It
- Correct Depreciation: Different assets lose value at different rates. A computer depreciates faster than a building. Categories ensure the right rate is applied.
- Tax Compliance: Ethiopian tax law specifies depreciation rates for different asset types. Using categories ensures you comply.
- Organization: Categories make it easy to find and manage similar assets together.
- Reporting: You can generate reports by category to see the total value of all vehicles, computers, etc.
Standard Asset Categories (Ethiopian Straight-Line)
Gibir-Negari uses straight-line depreciation only. Set useful life (years) = 100 ÷ statutory annual rate (rounded to whole years). Monthly expense = purchase cost ÷ (useful life × 12).
| Category | Statutory SL rate | Useful life (years) | Implied annual rate |
|---|---|---|---|
| Buildings | 5% | 20 | 5.0% |
| Computer Hardware | 20% | 5 | 20.0% |
| Office Equipment | 15% | 7 | ~14.3% |
| Furniture and Fixtures | 15% | 7 | ~14.3% |
| Motor Vehicles | 15% | 7 | ~14.3% |
For 15% statutory rates, useful life is 7 years (100÷15 rounded) because only whole years are supported; the effective rate is slightly below 15%. Buildings must use straight-line under Ethiopian rules. Diminishing value is not used in Gibir-Negari at this time.
Step-by-Step Operations
AView Asset Categories
- Navigate to Asset Categories.
- You will see each category's method, useful life (years), implied annual rate, and linked GL accounts.
- The system comes with five standard Ethiopian categories pre-configured (see table above).
BCreate a Custom Category
- Click Add to create a new category.
- Enter a Category Name (matching a preset name auto-fills useful life).
- Keep Straight line as the method and enter Useful life (years) using 100 ÷ statutory rate (e.g. 15% → 7 years).
- Link the fixed asset, accumulated depreciation, and expense accounts, then click Save.
CEdit or Delete a Category
- From the Asset Categories list, click the Pencil (Edit) icon to change useful life or linked accounts. Changing life does not regenerate schedules on existing assets.
- To delete a category, click the Trash (Delete) icon. Note: You can only delete a category if no assets are assigned to it.
Fixed Assets (Tracking Big Purchases)
📌 Quick Definition
Fixed Assets are expensive items your business owns that will last for years: vehicles, computers, furniture, buildings, machinery. Unlike regular expenses, you don't write them off immediately. Instead, you record them as assets and gradually reduce their value through depreciation.
Capital purchases recorded in the Purchases module let you pick an asset category per line and optionally create the fixed asset on save. Configure categories first under Asset Categories.
🎯 What It Does
The Fixed Assets module tracks every major purchase your business makes. It automatically calculates depreciation each month, reducing the asset's value according to its category's depreciation rate. When you sell or dispose of an asset, the system calculates any gain or loss on the sale.
❓ Why You Need It
- Accurate Balance Sheet: Your Balance Sheet must show the current value of all assets. The system calculates this automatically.
- Tax Deductions: Depreciation is a tax-deductible expense. Proper asset tracking ensures you claim all allowed deductions.
- Compliance: Ethiopian tax law requires businesses to maintain a fixed asset register. This module is your register.
- Disposal Tracking: When you sell or scrap an asset, the system calculates the gain/loss for tax purposes.
How Depreciation Works
Example: You buy a delivery van for 500,000 Birr (including VAT). Assign it to Motor Vehicles (7-year useful life, 15% statutory straight-line).
- Month 1: Van book value starts at 500,000 Birr. Depreciation = 500,000 ÷ 7 ÷ 12 ≈ 5,952.38 Birr
- Month 2: Book value ≈ 494,047.62 Birr. Same monthly amount until fully depreciated
- Year 1 total: About 71,428.57 Birr depreciation (~14.3% of cost)
- Year 7: Van reaches zero book value (fully depreciated over 84 months)
The system calculates this automatically every month and posts a depreciation expense to your Profit & Loss statement.
📊 Asset Lifecycle Tracking
From purchase to disposal, the system tracks every stage of an asset's life. You can see the original cost, accumulated depreciation, current book value, and disposal details all in one place.
💰 Automatic Value Loss (Depreciation)
Cars and computers lose value over time. You don't have to calculate this yourself! The system automatically writes a small expense entry every month, reducing the asset's value according to Ethiopian tax rules.
🔄 Selling or Breaking an Asset
If a computer breaks, or you decide to sell the delivery van, you can mark it as "Disposed" in the system. We will automatically do the complicated math to figure out if you made a profit or took a loss on the sale.
📋 Fixed Asset Register
The system maintains a complete register of all your assets, which is required by Ethiopian tax law. You can export this register for audits or tax filings.
Step-by-Step Operations
Here are the common operations for managing your business's fixed assets and tracking their depreciation over time.
AView Asset Dashboard
- Navigate to the Fixed Assets page.
- View top-level metrics summarizing your Total Assets count, Total Cost, and Current Value (after depreciation).
- Use the search bar to locate an asset quickly by its assigned Number or Name.
- Use the Category filter to view only assets of a specific type (e.g., all Vehicles).
BAdd a New Asset
- Click "Add Asset" to go to the Creation Page.
- Basic Details: Enter the Name and select the correct Category (e.g., Vehicles, Computers). The system uses the Category to know how fast it should lose value.
- Purchase Info: Enter the Purchase Date and the Purchase value Before VAT. (The system will calculate VAT separately if applicable.)
- Existing Assets: If you bought this asset years ago and are just now putting it into the system, turn on the "Existing asset" switch. You can then enter the "Opening accumulated depreciation" (how much value it has already lost).
- Optionally add a Location (where the asset is stored) and Custodian (the person responsible for it).
- Click "Create Asset". The system will automatically generate a unique Asset Number for it and begin calculating monthly depreciation.
CView Asset Details & Depreciation Schedule
- From the Fixed Assets list, click "View" on any asset row.
- You will see its comprehensive profile, including:
- Original purchase cost and date
- Accumulated depreciation to date
- Current book value (cost minus accumulated depreciation)
- Monthly depreciation amount
- Estimated useful life remaining
- Scroll down to see the Depreciation Schedule, which shows month-by-month depreciation entries.
DDispose of an Asset (Sell or Scrap)
- From the asset details page, click the "Dispose" button.
- Enter the Disposal Date and the Sale Price (if sold) or leave it blank (if scrapped).
- The system will automatically calculate the gain or loss on disposal:
- Gain: If you sold it for more than its current book value
- Loss: If you sold it for less than its current book value
- Click "Confirm Disposal". The system will post the gain/loss to your Profit & Loss statement.
EExport Fixed Asset Register
- From the Fixed Assets page, click the "Export" button.
- Choose your preferred format (PDF or Excel).
- The exported file will include all assets, their costs, accumulated depreciation, and current values.
- Use this register for tax audits, bank applications, or insurance purposes.
Trial Balance (The Balancing Check)
The Trial Balance is the simplest but most important sanity check in all of accounting. It answers one question: Do my total Debits equal my total Credits? If they do, your books are mathematically sound. If they don't, something was recorded incorrectly and you need to find it before producing any reports.
What It Shows
How It Works Behind the Scenes
Every time a journal entry is Posted, the system adds its debits and credits to the running total for each account involved. The Trial Balance simply reads those totals and displays them side by side. It does not create any new transactions; it is a read-only snapshot.
Real-World Analogy: Think of it as a cash register at the end of the day. You count all the money that came in and all the money that went out. If the numbers match, your day is balanced. If they don't, someone made a mistake somewhere.
Why It Matters
- Catch Errors Early: If an entry was accidentally one-sided (debit without credit), the Trial Balance immediately reveals the imbalance.
- Prerequisite for Reports: You should always check the Trial Balance before generating a Balance Sheet or Profit and Loss, because those reports assume your books are balanced.
- Auditor Confidence: Auditors and tax inspectors always ask for a Trial Balance first. A clean one tells them your records are reliable.
Step-by-Step Operations
AView the Trial Balance
- Navigate to Trial Balance.
- The page displays all accounts with non-zero balances, grouped by type (Assets, Liabilities, Equity, Revenue, Expenses).
- Check the footer row: if Total Debits = Total Credits, you will see the green "Balanced" badge.
BInvestigate an Imbalance
- If the Trial Balance shows an imbalance, note the difference amount.
- Go to the General Ledger and search for recent entries matching that amount.
- Look for entries that are still in Draft status or entries where only one side was recorded.
- Correct the entry and re-check the Trial Balance.
Opening Balances (Your Starting Point)
When you start using Gibir-Negari, your business doesn't begin from zero. You already have cash in the bank, equipment in your office, and maybe loans you owe. Opening Balances let you tell the system exactly where you stand on Day One so that every future report is accurate.
What It Shows
How It Works Behind the Scenes
When you save your opening balances, the system creates a special Opening Balance Journal Entry dated at your fiscal year start. This entry debits each asset account and credits each liability/equity account with the amounts you provided. From that point on, all future transactions build on top of this foundation.
Real-World Analogy: Imagine you are transferring the score of a board game to a new scoresheet. You write down every player's current score before continuing the game. If you skip this step, the final scores will be wrong.
Why It Matters
- Historical Accuracy: Without opening balances, your Balance Sheet will be missing assets you own and debts you owe, giving a false picture of your finances.
- Correct Depreciation: If you have existing assets, entering their opening accumulated depreciation ensures the system doesn't re-depreciate value that was already lost.
- Smooth Migration: Whether you are switching from paper-based records or from another software, opening balances bridge the gap seamlessly.
Step-by-Step Operations
AEnter Opening Balances
- Navigate to Opening Balances.
- You will see a table of all your accounts. For each account with a starting balance, enter the amount in the Debit or Credit column.
- Asset accounts (cash, bank, inventory) go into the Debit column. Liability and Equity accounts (loans, owner capital) go into the Credit column.
- Watch the totals at the bottom. They must be equal before you can save.
- Click "Save Opening Balances".
BCorrect Opening Balances
- If you made a mistake, return to the Opening Balances page.
- Adjust the incorrect values and re-save.
- The system will update the underlying journal entry automatically.
- Note: You can only edit opening balances if no other journal entries have been posted yet. If entries exist, you must create a manual adjustment instead.
Balance Sheet (Your Financial Snapshot)
The Balance Sheet is one of the three core financial statements. It answers the question: What does my business own, what does it owe, and what is left over for the owners? It is always calculated at a specific date (a "snapshot in time").
What It Shows
How It Works Behind the Scenes
The system reads the balance of every account classified as Asset, Liability, or Equity from posted journal entries up to the date you select. It groups them into three columns and calculates: Assets = Liabilities + Equity. This equation must always hold true; if it doesn't, there is an error in your books.
The Accounting Equation: Assets = Liabilities + Equity. This is the foundation of double-entry bookkeeping. Every transaction you record maintains this equation. The Balance Sheet simply displays the result.
Why It Matters
- Know Your Net Worth: Owners and investors look at the Balance Sheet to understand the actual financial position of the business.
- Loan Applications: Banks in Ethiopia require a Balance Sheet when you apply for credit. A strong Balance Sheet (more assets than liabilities) improves your chances.
- Legal Compliance: Ethiopian commercial law requires businesses to prepare annual financial statements, which always include a Balance Sheet.
- Spot Trends: Comparing Balance Sheets month-over-month or year-over-year reveals whether your business is growing, stagnating, or shrinking.
Step-by-Step Operations
AGenerate a Balance Sheet
- Navigate to Balance Sheet.
- Select the As-of Date (the date you want the snapshot for, e.g., end of the month or end of the fiscal year).
- The report auto-generates, showing Assets on one side and Liabilities + Equity on the other.
- Verify that both sides are equal. If they are, the report is reliable.
BExport or Print
- Once the Balance Sheet is displayed, click the Export or Print button.
- Choose your preferred format (PDF or Excel).
- Use this exported file for bank applications, board meetings, or tax filings.
Profit & Loss (Are You Making Money?)
The Profit & Loss statement (also called the Income Statement) is the second core financial report. While the Balance Sheet shows your position at a single moment, the P&L shows your performance over a period of time. It answers: How much did we earn? How much did we spend? Did we end up with a profit or a loss?
What It Shows
How It Works Behind the Scenes
The system filters all posted journal entries within the date range you select. It sums up the credits on Revenue accounts (money earned) and the debits on Expense accounts (money spent). The difference between the two totals gives your net profit or loss.
Real-World Analogy: Imagine a shop owner who puts all daily earnings into a green box and all daily costs into a red box. At the end of the month, she opens both boxes: if the green box has more money, she made a profit. The P&L report does this automatically for your entire business.
Why It Matters
- Measure Performance: The P&L tells you whether your business is actually profitable after all expenses are accounted for.
- Tax Calculation: Ethiopian income tax (business profit tax) is calculated based on your net profit. An accurate P&L is essential for correct tax filing.
- Cost Control: By seeing expenses broken down by category, you can identify areas where spending is too high and take action.
- Investor Communication: If you seek funding, investors will ask for your P&L to understand your revenue trajectory and cost structure.
Step-by-Step Operations
AGenerate a Profit & Loss Report
- Navigate to Profit & Loss.
- Select the Start Date and End Date for the period you want to analyze (e.g., Meskerem 1 to Pagume 5 for a full fiscal year).
- The report generates automatically, showing Revenue at the top, Expenses below, and Net Profit/Loss at the bottom.
BCompare Periods
- Generate a P&L for the current month, then generate another for the previous month.
- Compare the two reports side by side to identify revenue growth or expense spikes.
- Use this comparison to make informed decisions about pricing, staffing, or cost-cutting.
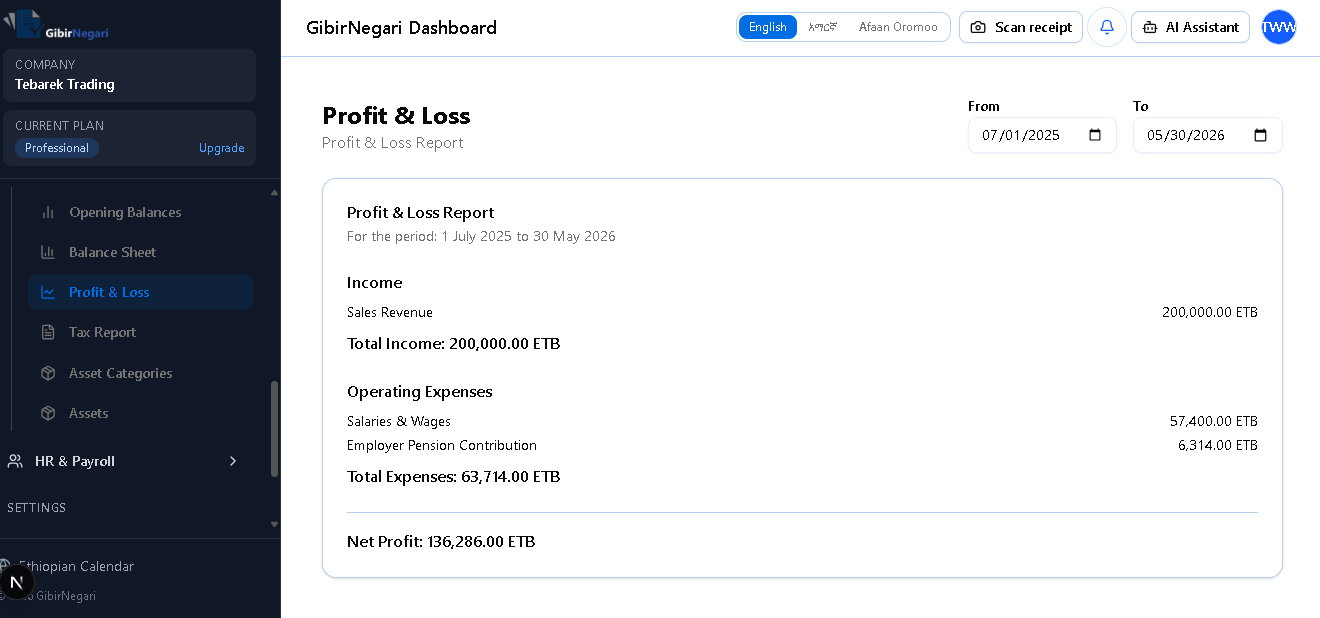
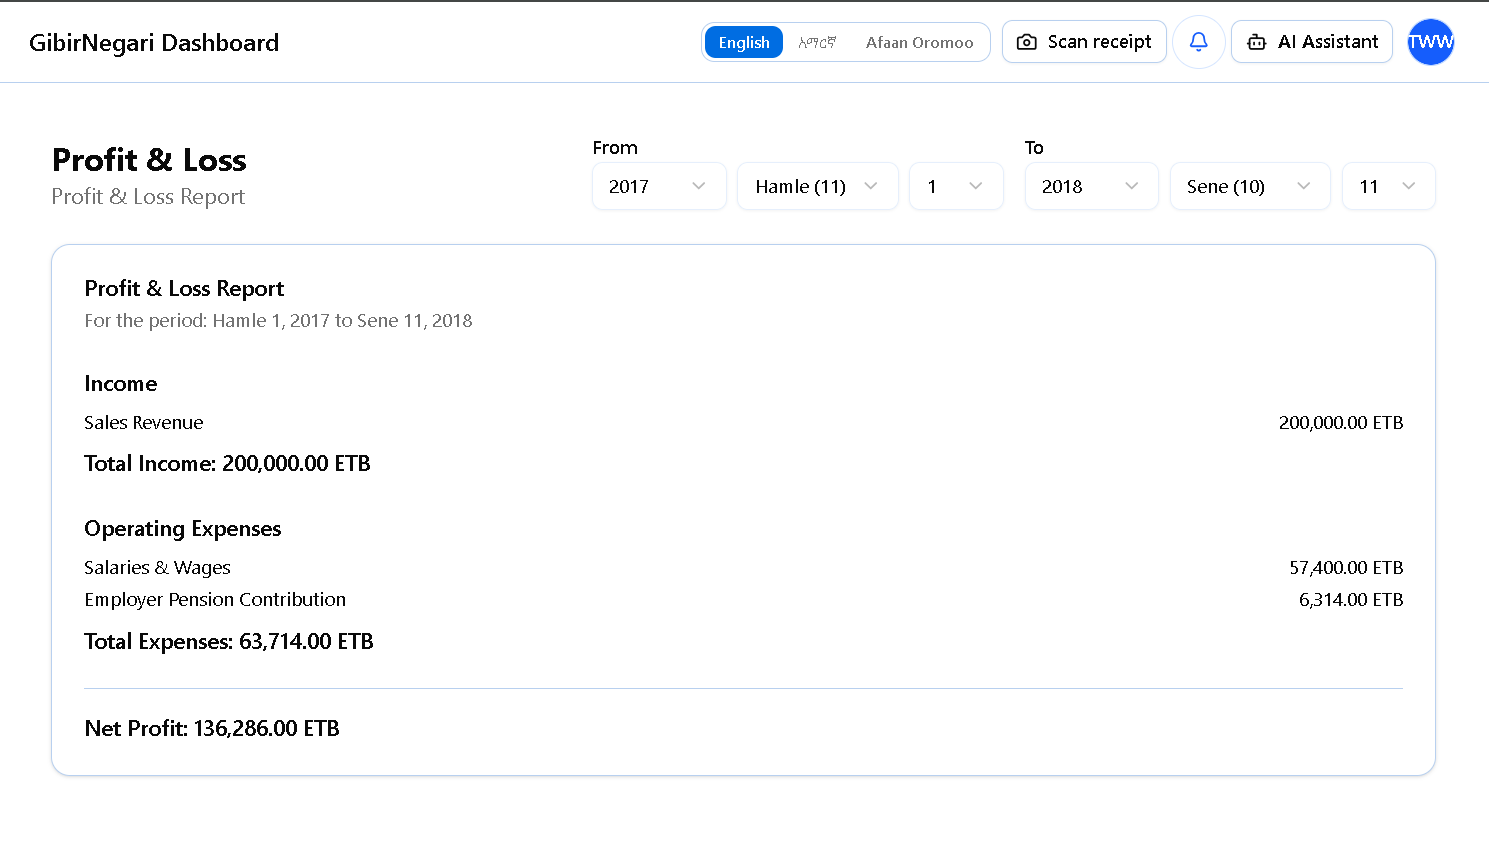
The Profit & Loss report interface displaying a comprehensive financial performance summary. This example shows Tabarek Trading's P&L for the period July 1, 2025 to May 30, 2026, with Sales Revenue of 200,000 ETB, Operating Expenses of 63,714 ETB (including Salaries & Wages and Employer Pension Contribution), resulting in a Net Profit of 136,286 ETB. The report features date range selectors (From/To), Ethiopian calendar support, and clear categorization of income and expenses for easy financial analysis.
💡 Understanding Your P&L Report
The Profit & Loss report is your business's financial scorecard. Here's how to read it:
- Income Section: Shows all revenue streams (Sales Revenue, Service Income, etc.). The Total Income line sums all revenue for the period.
- Operating Expenses Section: Lists all business costs categorized by type (Salaries, Rent, Utilities, Depreciation, etc.). The Total Expenses line shows your total spending.
- Net Profit/Loss: The bottom line - Total Income minus Total Expenses. A positive number (green) means profit; negative (red) means loss.
- Date Range: Always check the period covered. Monthly reports help track trends; annual reports show overall performance.
- Ethiopian Calendar Support: The system supports both Ethiopian and Gregorian calendars, making it easy to align with fiscal year requirements.
Tax Report (Stay Compliant with ERCA)
The Tax Report module pulls data from your posted transactions and automatically calculates the taxes your business owes or has collected. In Ethiopia, this primarily covers VAT (Value Added Tax), Withholding Tax, and Income Tax. Instead of manually combing through hundreds of invoices, the system does the math for you.
What It Shows
How It Works Behind the Scenes
Every time you record a sale, the system automatically splits the total into the pre-tax amount and the 15% VAT, posting each to the correct account. Similarly, purchases with VAT are split automatically. The Tax Report aggregates all these split entries for a given period and presents the totals.
Important for Ethiopian Businesses: VAT-registered businesses must file a VAT return with ERCA every month. The Tax Report gives you the exact numbers you need to fill in the ERCA form, saving hours of manual calculation and reducing the risk of penalties.
Why It Matters
- Avoid Penalties: Late or incorrect tax filings can result in fines from ERCA. The Tax Report ensures your numbers are always accurate and ready on time.
- Audit Protection: If ERCA audits your business, having clean, system-generated tax reports with a full audit trail dramatically reduces your risk.
- Cash Flow Planning: Knowing exactly how much tax you owe helps you plan your cash flow. No surprises at filing time.
- Automatic Calculations: You don't need to manually calculate 15% VAT or 2% withholding. The system handles it from the moment you record the transaction.
Step-by-Step Operations
AGenerate a Tax Report
- Navigate to Tax Report.
- Select the Tax Period (e.g., the current month) and the type of tax you want to review (VAT, Withholding, or All).
- The system generates the report showing all taxable transactions, grouped by type, with totals calculated automatically.
BExport for ERCA Filing
- Once the report is generated, click "Export" to download it as PDF or Excel.
- Use the exported numbers to fill in your ERCA VAT return form.
- Keep the exported file as a backup for your records in case of future audits.
Asset Categories (Depreciation Rules)
Asset Categories define groups of similar assets (e.g., Vehicles, Office Furniture, Computer Equipment) and, most importantly, set the depreciation rules for each group. When you add a new asset and assign it to a category, the system automatically knows how fast that asset should lose value each year.
What It Shows
How It Works Behind the Scenes
When you create an asset and assign it to a category (e.g., "Computer Hardware" with 5-year useful life), the system calculates monthly depreciation: Purchase cost ÷ (useful life × 12). Each period it posts a journal entry debiting Depreciation Expense and crediting Accumulated Depreciation. You do not calculate depreciation manually.
Ethiopian Tax Alignment: Federal Income Tax straight-line rates include 5% for buildings, 20% for computer hardware, and 15% for office equipment, furniture, and motor vehicles. Gibir-Negari maps these to useful life years (see the standard categories table in the overview section).
Why It Matters
- Automated Depreciation: Without categories, you would have to manually calculate and record depreciation for every single asset every month. Categories automate this entirely.
- Tax Compliance: Correct depreciation rates ensure your tax deductions are legitimate and match ERCA expectations.
- Accurate Asset Values: The Balance Sheet reflects the true current value (net book value) of your assets, not just what you originally paid.
- Consistency: All assets of the same type are treated identically, preventing mistakes from manual per-asset calculations.
Step-by-Step Operations
AView Existing Categories
- Navigate to Asset Categories.
- You will see a table listing each category with method, useful life, implied rate, and linked accounts.
- Five Ethiopian presets are pre-loaded: Buildings, Computer Hardware, Office Equipment, Furniture and Fixtures, Motor Vehicles.
BCreate a New Category
- Click "Add Category".
- Enter the Category Name (e.g., "IT Equipment") and optional Description.
- Keep Straight line as the depreciation method.
- Enter Useful life (years) using 100 ÷ statutory rate (5%→20, 15%→7, 20%→5).
- Link the category to the correct Chart of Accounts (fixed asset, accumulated depreciation, depreciation expense).
- Click "Save". All future assets assigned to this category will automatically use these settings.
CEdit or Remove a Category
- Click the Edit icon to change name, useful life, or linked accounts. Existing asset schedules are not regenerated automatically.
- To delete a category, click the Delete icon. Note: You cannot delete a category that has assets assigned to it. Reassign those assets first.
Page Interactions & Features
Here is a detailed breakdown of what you can do on each of the main pages within the Accounting & Finance module and the features available through various buttons.
1Chart of Accounts Page
Your comprehensive financial filing system where you manage all ledger accounts for your business.
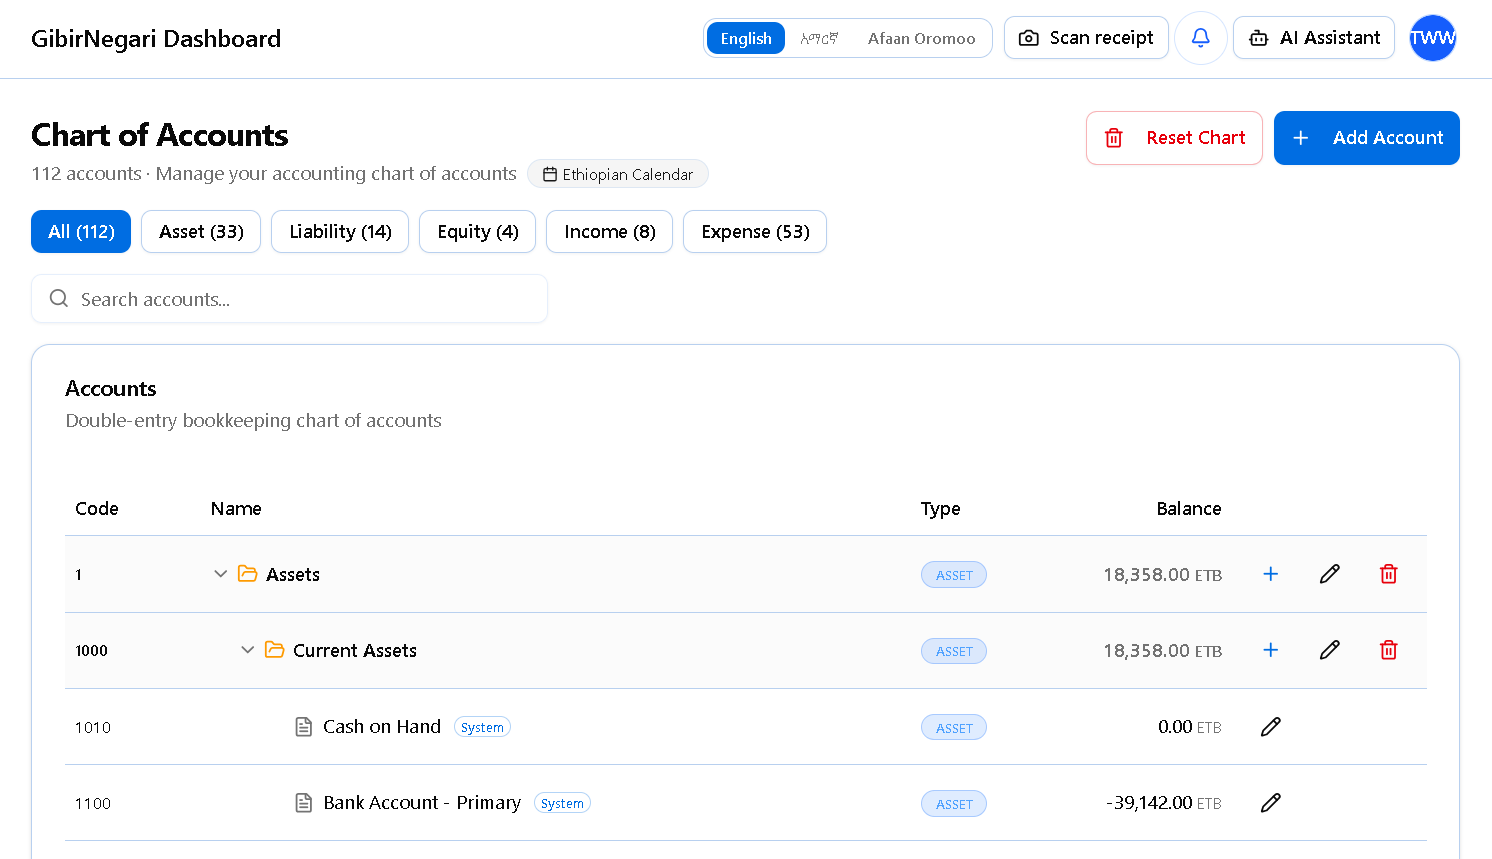
The Chart of Accounts interface where you manage your financial filing system and ledger accounts.
- What it Shows: A hierarchical, nested list of all your accounts. Columns include the Account Code, Account Name, Type (Asset, Liability, Equity, Revenue, Expense), current Balance, and quick action icons. System-locked accounts display a lock icon indicating they cannot be deleted or fundamentally changed.
- Category Filters: Tab buttons across the top (All, Assets, Liabilities, Equity, Revenue, Expenses) allow you to quickly filter the massive list of accounts by their core accounting type.
- Search Bar: Instantly locate an account by typing its name (e.g., "Cash") or account code (e.g., "1000").
- "Add Account" Button: Opens a detailed side-panel to create a new account. You must specify: Name, Code, Type, whether it is a "Group" (folder) or "Detail" (bucket) account, the Parent Group it belongs under, and optional ERCA tax-line mappings for Schedule C automated reporting.
- "+" (Plus) Icon: Located next to group accounts in the list. Clicking this is a shortcut that opens the Add Account dialog with that specific group pre-selected as the parent folder.
- Pencil (Edit) & Trash (Delete) Icons: Allow you to modify an account's name/code or permanently remove it. Safeguard: The system physically prevents you from deleting any account that has historical journal entries attached to it.
- "Reset Chart" Button: A danger-zone action to wipe all user-created accounts and start fresh with the default ERCA-compliant template. Only visible and available if absolutely zero journal entries have been recorded in the business yet.
2General Ledger Page
The master log of every financial transaction (Journal Entry) that occurs in your business.
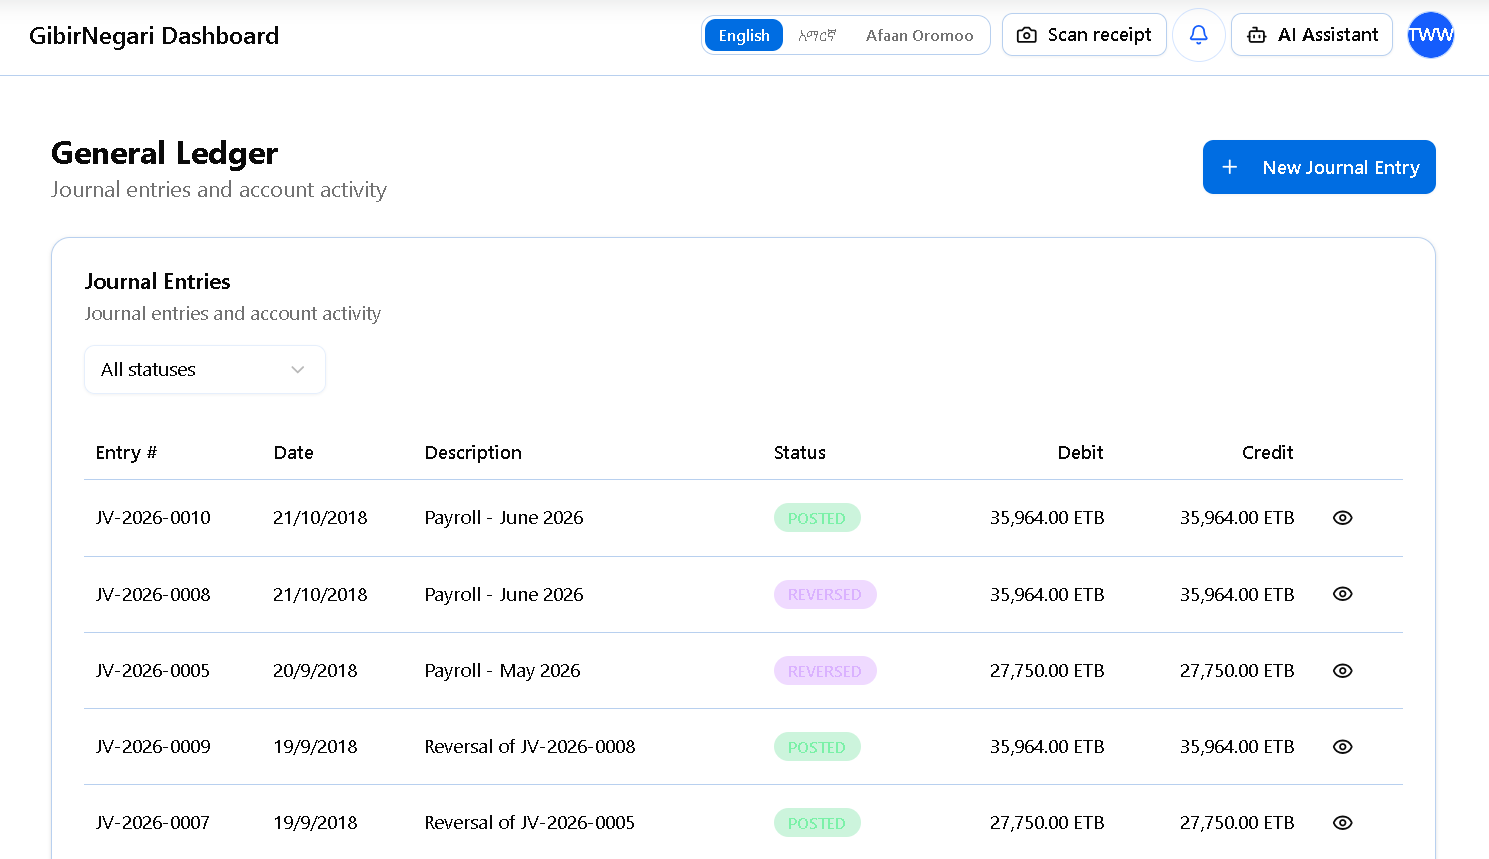
The General Ledger interface where you can view, filter, and manage all financial transactions.
- What it Shows: A chronological table of journal entries. Columns include Date, Entry #, Source Document (e.g., Sales Invoice #001, Purchase #045, or Manual), Description, total Debit, total Credit, and Status.
- Status Filter: A dropdown allowing you to filter entries by status: Draft (saved but not impacting balances), Posted (locked and impacting balances), or Voided (cancelled).
- Account Filter & Date Range: Crucial tools for auditing. You can narrow the ledger to only show transactions that affected the "Petty Cash" account between Meskerem 1 and Tikimt 30.
- "New Entry" Button: Redirects to the Manual Journal Entry screen. Here you can record custom accounting adjustments (like depreciation adjustments or owner drawings) by picking the exact accounts to debit and credit, ensuring they balance to zero before saving.
- Eye (View) Icon: Opens the deep-dive view of a specific journal entry, showing the exact T-account breakdown (every debit line and credit line).
- "Post", "Reverse", & "Void" Buttons: Available inside the entry view. Post a draft to make it official. If an error is found in a Posted entry, you cannot delete it (to maintain audit trails); instead, you use the Reverse button to create an opposite mathematical entry, or Void it entirely.
3Trial Balance Page
A foundational accounting report listing the closing balances of all ledger accounts on a certain date to ensure the accounting equation balances.
- What it Shows: A flat, un-nested table listing Account Code, Account Name, Account Type, and the final Debit Balance or Credit Balance for each account.
- Summary Footer: Fixed at the bottom of the screen, instantly displaying the Total Debits vs Total Credits. It prominently displays a green "Balanced" badge (indicating your books are mathematically correct) or a red "Unbalanced" badge.
- "As of Date" Picker: Choose the exact date for the report using the dual Ethiopian/Gregorian calendar. The report calculates all posted entries up to 11:59 PM on that date.
- "Include zero balances" Checkbox: Toggle whether to show accounts that currently have a 0.00 ETB balance. Enabling this is useful for auditors to verify that certain accounts were deliberately cleared out.
- "Refresh" Button: Recalculates the trial balance immediately if you just posted a new transaction in another tab.
- "Export CSV" Button: Downloads the trial balance into an Excel-compatible spreadsheet, which is frequently requested by external accounting firms when preparing annual audits.
4Opening Balances Page
The specialized data-entry screen used to input your company's initial financial standing when first migrating to Gibir-Negari.
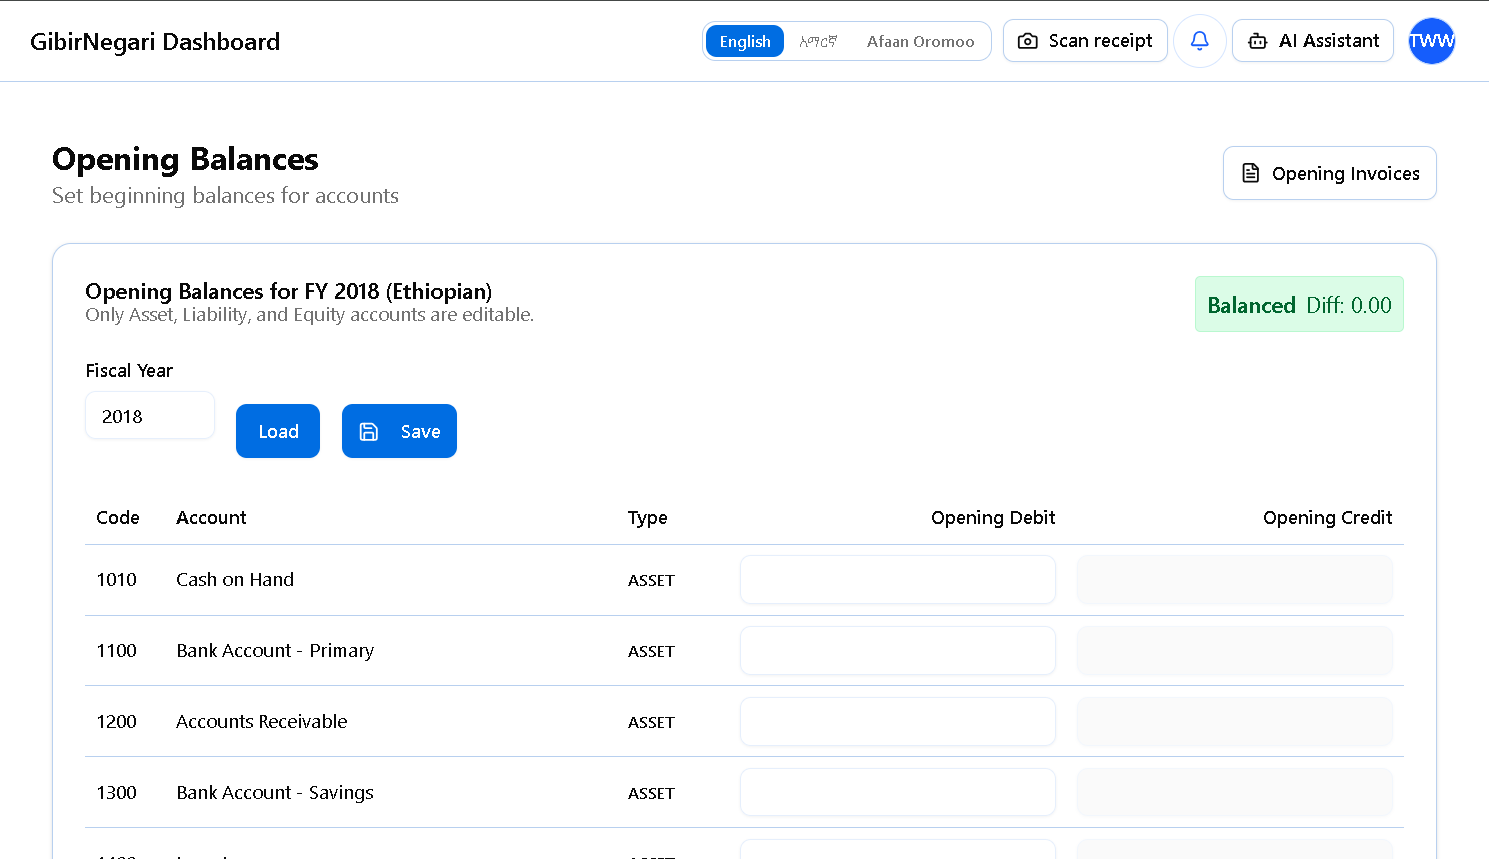
The Opening Balances data-entry screen for setting up your initial financial standing.
- What it Shows: A massive grid of every single detail account in your Chart of Accounts, with empty input boxes next to them for "Debit" and "Credit".
- Transition Date Picker: Select the date when these starting balances apply (usually the start of a fiscal year, e.g., Hamle 1).
- Input Grid Logic: You enter the starting balances from your old accounting software or excel sheet. If Cash had 50,000 ETB, you enter 50,000 in the Debit column. If a Bank Loan had 100,000 ETB, you enter 100,000 in the Credit column.
- Live Balancing Footer: As you type, a sticky footer calculates the total debits and total credits you've entered. The system will not allow you to save until the difference is exactly 0.00, ensuring your books start in a balanced state.
- "Save Opening Balances" Button: Once balanced, clicking this generates a massive, locked Journal Entry in the General Ledger dated on your Transition Date, establishing your financial baseline.
5Inventory (Valuation) Page
A crucial end-of-period tool to adjust your system's accounting inventory balance to match a real-world physical stock count.
- What it Shows: A guided form to calculate shrinkage or unrecorded cost of goods sold. It displays a prominent, read-only "Current System Balance" showing what Gibir-Negari thinks your inventory is worth based on recorded purchases.
- "As of Date" Picker: Set the exact date the physical warehouse inventory count was conducted.
- "Target Value" Input: Enter the actual ETB valuation resulting from your physical warehouse count.
- Live Adjustment Preview: As soon as you enter the Target Value, the page dynamically calculates the difference (Delta). It displays a text preview explaining exactly what journal entry it will create (e.g., "-15,000 ETB (Dr COGS / Cr Inventory)" for shrinkage, or "+5,000 ETB (Dr Inventory / Cr COGS)" for overage).
- Account Selectors: Two dropdowns to explicitly choose which Chart of Accounts bucket represents the Inventory Asset, and which bucket represents the Offset / Cost of Goods Sold expense.
- "Post Adjustment" Button: Executes the calculation and automatically injects the balancing journal entry into the ledger to align your books with physical reality.
6Balance Sheet Page
Your core financial snapshot demonstrating the company's net worth (Assets = Liabilities + Equity) on a specific date.
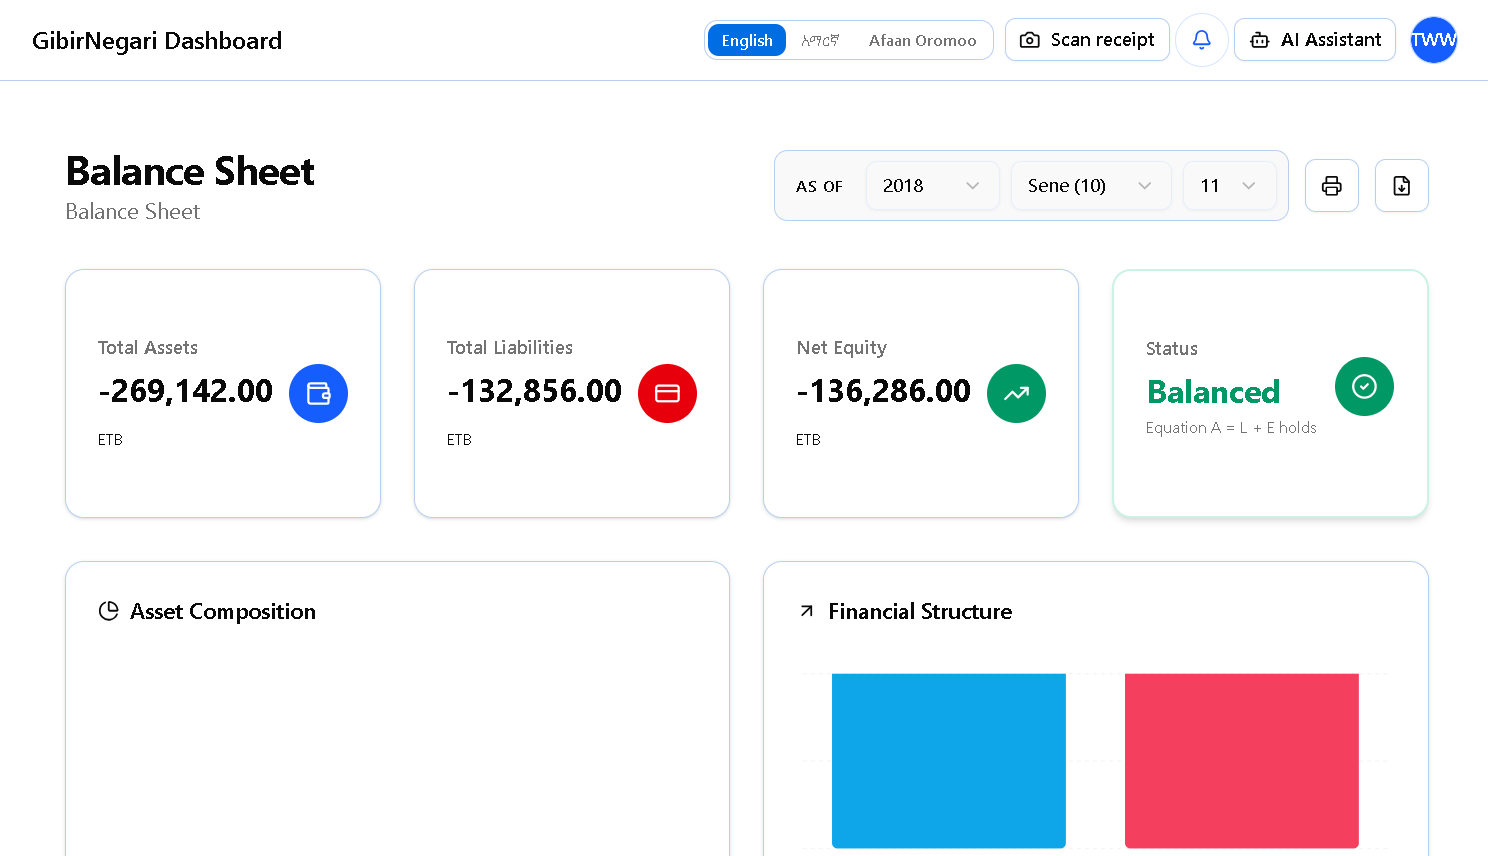
The Balance Sheet report interface showing a snapshot of your company's net worth.
- What it Shows: A highly structured, standardized report. It groups accounts into Current Assets (Cash, Bank, AR, Inventory), Fixed Assets (Property, Equipment minus Accumulated Depreciation), Current Liabilities (AP, Taxes Payable), Long-term Liabilities (Loans), and Equity (Capital, Retained Earnings, Current Year Net Income).
- "As of Date" Picker: Unlike the P&L which covers a range, the Balance Sheet is a snapshot of a single day. Select the date and click Generate.
- Net Income Injection: The report dynamically calculates your net income up to the selected date and injects it into the Equity section so the report balances perfectly.
- Print & Export Buttons: One-click options to print the report to a formatted PDF or export data to Excel. This layout is specifically designed to match what Ethiopian banks require for loan applications.
7Profit & Loss Page
The income statement report showing your company's financial performance (revenue vs expenses) over a specific timeframe.
The Profit & Loss report interface summarizing revenue, expenses, and net profit over a selected period.
- What it Shows: A multi-step deduction report. It starts with Operating Revenue, subtracts Cost of Goods Sold (COGS) to give Gross Profit. It then lists all Operating Expenses (Salaries, Rent, Utilities, Depreciation) to calculate Operating Profit. Finally, it accounts for Non-Operating Items (like interest income) to arrive at the bottom-line Net Profit or Loss.
- Start & End Date Pickers: Define the exact boundary for the report. You can set this to a single month (e.g., Ginbot 1 to Ginbot 30) for monthly reviews, or a full Ethiopian Fiscal Year (Hamle 1 to Sene 30) for annual reporting.
- Generate Button: Triggers the system to aggregate thousands of ledger entries within the date range into the summarized categories.
- Visual Profit Indicator: The final Net Profit number is distinctly colored (Green for profit, Red for loss) to give immediate visual feedback on business performance.
- Export Options: Save the P&L as a professional PDF document or CSV file for submission to tax authorities or investors.
8Tax Report Page
An automated compliance dashboard that aggregates transactional data into the exact figures needed for monthly/yearly ERCA declarations.
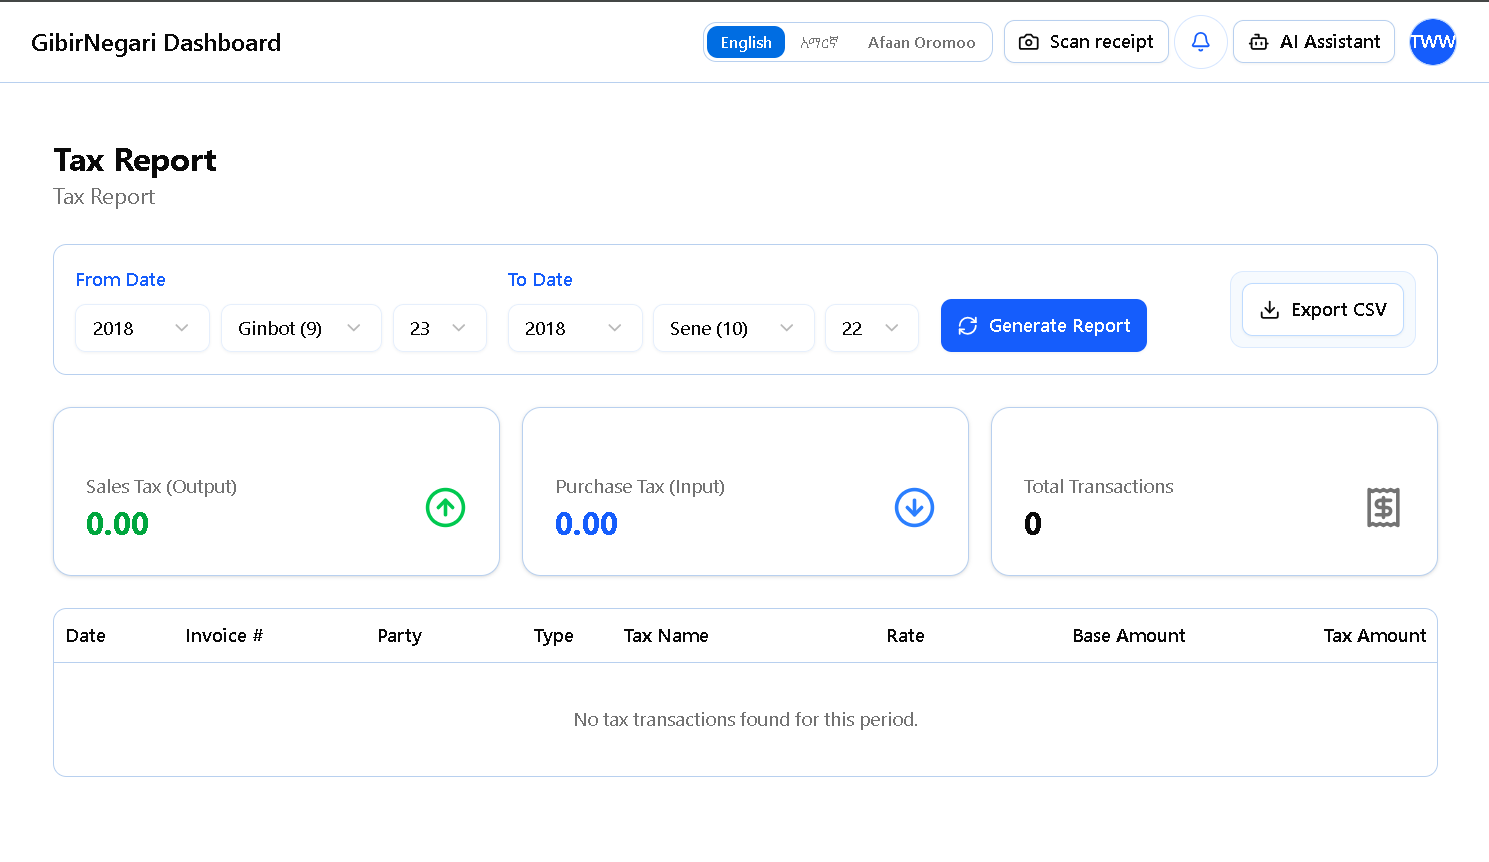
The Tax Report dashboard summarizing your tax liabilities for ERCA declarations.
- What it Shows: High-level cards summarizing tax liabilities. For VAT, it shows Total Taxable Sales, VAT Output (Collected), VAT Input (Paid on Purchases), and the final Net VAT Due/Refundable. For Withholding, it shows the total 2% deductions you held from suppliers that you must now remit to ERCA.
- Tax Period Selector: A dropdown to quickly select the specific Ethiopian calendar month (for VAT/WHT) or year (for Income Tax) you are preparing to file.
- Tax Type Filter: Toggle buttons to switch the dashboard view between VAT, Withholding Tax, and Business Profit Tax estimations.
- "View Details" Links: Clickable links next to summary numbers that open a modal showing every specific invoice or receipt that contributed to that tax total, crucial for audit defense.
- Export Button: Downloads the summarized data in an ERCA-friendly format, allowing you or your accountant to simply copy-paste the numbers into the eTax portal.
9Asset Categories Page
The configuration area where you manage the depreciation and amortization rules, along with General Ledger account mappings for different classes of fixed and intangible assets.
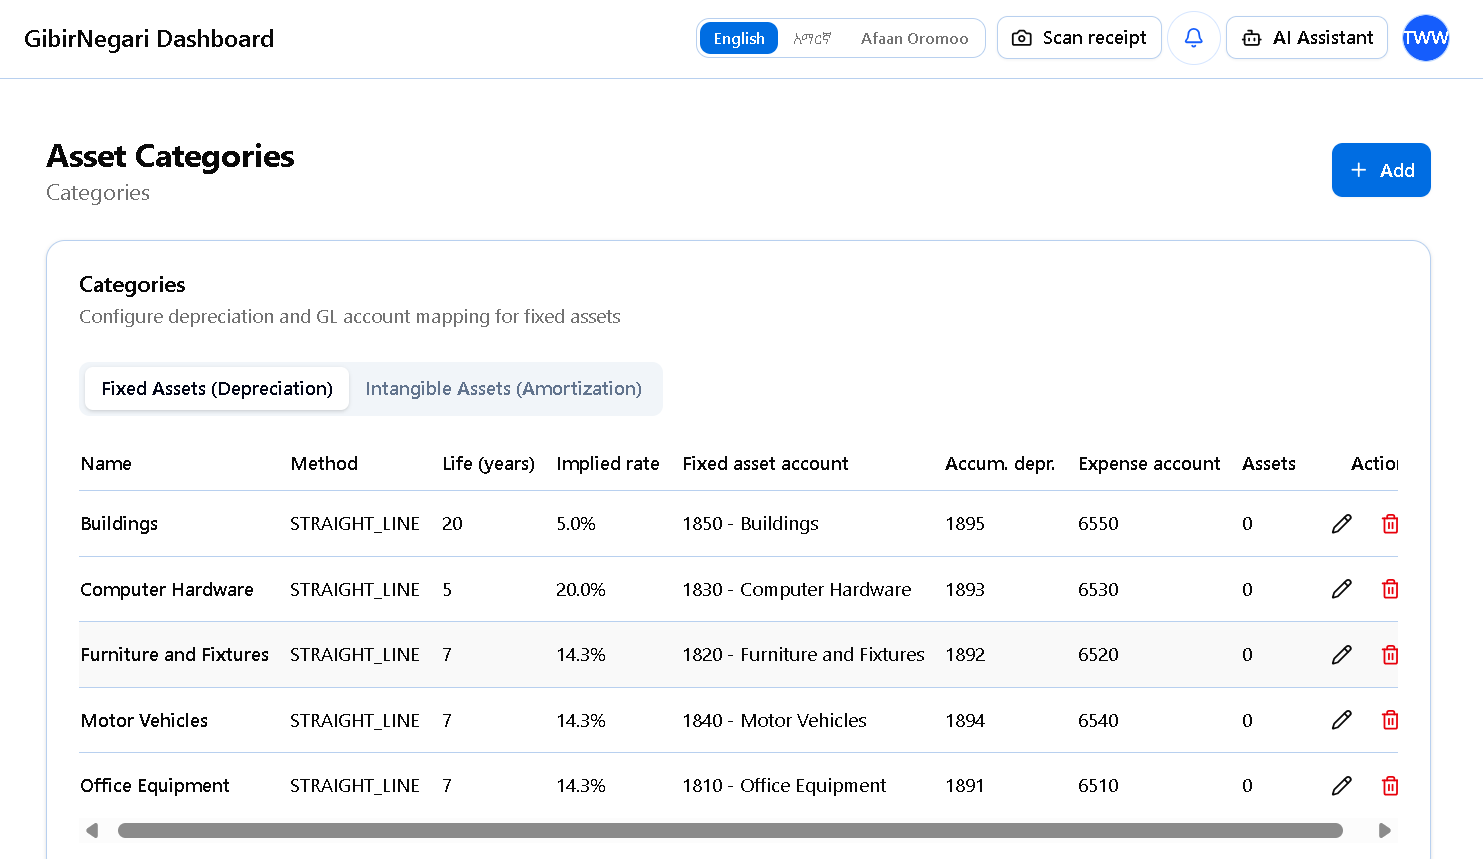
The Asset Categories configuration page for setting depreciation and amortization schedules.
- What it Shows: A table listing categories (e.g., "Vehicles", "Computers", "Buildings", "Software Licenses"). Columns include the Category Name, Useful Life (years), derived Statutory Rate (%), and the three linked GL accounts.
- "Add Category" Button: Opens a form to create a new grouping. You define its Useful Life based on Ethiopian straight-line depreciation or amortization tax laws (e.g., entering 5 years for a 20% computer depreciation rate, or defining the useful life for amortizing intangible assets).
- Account Linking Pickers: Three dropdowns where you must select the Chart of Accounts buckets that will hold the Asset Value (Asset type), the Accumulated Depreciation/Amortization (Contra-Asset type), and the Depreciation/Amortization Expense (Expense type) for items in this category.
- Pencil (Edit) & Trash (Delete) Icons: Update a category's lifespan or delete it. Note: The system blocks deletion if any physical or intangible assets are currently assigned to the category, preventing broken depreciation or amortization schedules.
10Assets Page
Your fixed asset register, tracking expensive, long-lasting capital purchases and their gradual loss of value over time.
- What it Shows: A comprehensive list of physical assets. Columns include Asset Name, Category, Purchase Date, original Purchase Cost, current calculated Book Value, and Status (Active, Fully Depreciated, or Disposed).
- "Register Asset" Button: A form to manually add a fixed asset. You input the Name, assign it to an Asset Category, enter the Purchase Date, Cost, and an optional Salvage Value (what it will be worth at the end of its life). (Note: Assets can also auto-populate from the Purchases module if marked as Capital).
- Depreciation Schedule View: Clicking on any asset opens its details, including a month-by-month table showing exactly how much depreciation expense will be posted, and the declining net book value over its useful life.
- "Dispose / Write-off" Button: Used when an asset is sold, scrapped, or destroyed before the end of its life. This form asks for the disposal date and sale price (if any), and automatically calculates and posts the final "Gain/Loss on Disposal of Asset" journal entry.
11Bank Reconciliation Page
Match your system's General Ledger transactions against your actual bank statements to ensure complete accuracy.
- Statement Import: Upload CSV/Excel statements from Ethiopian banks (e.g., CBE, Awash, Dashen) to automatically compare against system records.
- Transaction Matching: The system suggests matches for dates and amounts between the statement and your ledger.
- Discrepancy Resolution: Quickly spot missing expenses or untracked bank fees and create adjusting journal entries right from the reconciliation screen.
12Inventory Page
Manage your stock counts and valuation methods to accurately calculate Cost of Goods Sold (COGS).
- Valuation Methods: Support for standard ERCA-approved inventory valuation methods (FIFO or Weighted Average Cost).
- Stock Adjustments: Record inventory shrinkage, damage, or theft with automatic GL write-offs.
- COGS Calculation: Automatically calculates the Cost of Goods Sold during the end-of-period closing, directly impacting your Business Profit Tax.